While the IPCC models
projects higher rainfall for India, as the IMD graph illustrates the monsoons
demonstrate a 30-40 year multi-decadal cycle of alternate above average and
below average cycles. The latter finds no alignment with the AGW theory but
find relatively a much better correlation fit with the Pacific Decadal
Oscillation (PDO) cycle.
As mentioned earlier,
the AGW theory states that global warming induces an increase in global
precipitation through the augmentation of water evaporation. Warmer seas should
heat up the monsoon winds that carry moisture from the ocean to the land. In
turn, warmer winds should carry more moisture, so warmer oceans should lead to
more rain. This should in turn imply that global relative humidity and
evaporation levels should increase. So goes the AGW theory.
As the IMD graph shows,
we in India have had no such luck. Total rainfall during the Indian Summer
Monsoon is stable but with a slight tendency towards a negative mean departure,
practically falsifying the AGW hypothesis!! Global relative humidity and
evaporation levels have been decreasing - indicating a cooling trend. BN
Goswami, Director of IITM and chief of India’s Monsoon Forecasting Mission
admitted during a seminar in Pune:
“The potential
evaporation has decreased over the country and there has been a weakening of surface
winds.”

Rainfall is a
significantly larger variable to agricultural productivity than temperature.
Despite warming, agriculture booms where rainfall is adequate and is challenged
when rainfall fails. While our Met Dept and climatologists were still desperately
trying to figure out the reason for declining rainfall pattern for the last
century, it is clear that global warming doesn’t increase the Indian summer
monsoon rainfall as AGW models predict; it in fact appears to have reduced it:
“In yet another
pertinent study, Fleitmann et al. (2004) developed a stable isotope history
from three stalagmites in a cave in Southern Oman that provided an
annually-resolved 780-year record of Indian Ocean monsoon rainfall. Over the last eight decades of the 20th century,
when global temperatures rose dramatically as the earth emerged from the Little
Ice Age and entered the Modern Warm Period, Indian Ocean monsoon rainfall
declined dramatically, while the other most dramatic decline in monsoon
rainfall coincided with the major temperature spike that is evident in the
temperature records of Keigwin, Holmgren et al. and McIntyre and McKitrick.”
“...We subject the
Indian Monsoon rainfall and the sunspot occurrence activities with FFT and
wavelet analysis. It is found that both the activities have a common
periodicity of 22 year indicating that the solar cycle and activity phenomena
strongly influence the rainfall activity.”

CLICK IMAGE TO ENLARGE
Regarding the claim
of the ICRIER-GC study that: “Changes in rainfall (both distribution and
frequency) during monsoon and non-monsoon months”; the latest IPCC SREX Report
observed:
“There have been
statistically significant trends in the number of heavy precipitation events in
some regions. It is likely that more of these regions have experienced
increases than decreases, although there are strong regional and sub-regional
variations in these trends.”
Note that the IPCC
does not give a very high probability for such trends. There are of course
changes in the distribution and frequency of rainfall but certainly with no
cause for alarm as could be observed from the above table from an IIT-Rookeee-National Institute of
Hydology study where the underlined data marks those statistically
significant deviations.
All areas of the
country cannot be assumed to have even rainfall. At any point of time, some
areas will always experience higher than average rainfall; some others will
experience lower than average rainfall with most areas demonstrating no change
in rainfall. The spatial distribution
also changes over time as the climate is not a static phenomenon but changes
with reference to time. A study, “A 135-Year Rainfall History of India:
1871-2005” published in the Hydrological Sciences Journal
gives a confirmation
these facts:
“Half of the
sub-divisions showed an increasing trend in annual rainfall, but for only three
was this trend statistically significant...
Similarly, only one
sub-division indicated a significant decreasing trend out of the 15
sub-divisions showing decreasing trend in annual rainfall...
In terms of monthly
rainfall during the monsoon months of June to September, they found that
"during June and July, the number of sub-divisions showing increasing
rainfall is almost equal to those showing decreasing rainfall, and in August
the number of sub-divisions showing an increasing trend exceeds those showing a
decreasing trend, whereas in September, the situation is the opposite...
In addition, the
majority of sub-divisions showed very little change in monthly rainfall in most
of the months while for the whole of India; no significant trend was detected
for annual, seasonal, or monthly rainfall....
Thus this study could
not find any evidence of the increase in rainfall that the IPCC had suggested
would occur over India due to “accelerated global warming.”
It has to be
appreciated that the phenomenon of monsoons are not fully understood, leave
alone predicted successfully. The monsoons, by character, exhibit a wide range
of natural variability on the spatial, temporal, intra-seasonal, inter-annual
and decadal scale that characterise it’s pattern of distribution, frequency and
intensity of rainfall. The monsoon has always had its natural vagaries and it
is going to show them in future too.
Nothing in the
ICRIER-GC paper adequately explains or provides empirical evidence that
“climate change” has created a totally new set of variability of monsoons that
exacerbate its extreme event potential. In contrast to the ICRIER-GC paper, the
MoE&F paper - ‘Climate Change and India: A 4X4 Assessment’, provides a very
balance and non-alarmist discussion for monsoon variability in terms of distribution,
frequency and intensity. Read here.
But the problem with
the MoE&F paper is their reliance on computer model simulation for
forecasting the future. The Indian Meteorological Department (IMD)’s
statistical model has a success rate of only 22% while their new dynamic model
being experimented with has 26% - meaning that their predictions have only one
out of four or five probability of getting their monsoon predictions right.
This implies that computer modelled monsoon projections are highly undependable.
Rupa Kumar Kohli, now head of the World Meteorological Organization (WMO), one
of the two co-founding agencies of the IPCC conceded to the Times of India:
“Empirical models are
statistical projections based on observed meteorological data. They are limited
according to the data you are using.
Climate models are three-dimensional, atmospheric-general circulation
models, global in nature. These use known thermodynamic laws to describe the
atmosphere and its motions. So there's no data window.
From the scientific
perspective, models still have problems in realistically representing the
Indian monsoon. This has implications for the models' utility on a global
scale. Improving monsoon in models is a major challenge even in the developed
world.”
Agriculture besides
should primarily adapt to the weather first and then climate (average weather
over a period) in that order. This should be considered the first principle for
appropriate adaptation strategy as far as agriculture is concern.
And why is this so? This is because climate is just a mean curve
that had smoothened out all extreme weather fluctuations. For academic
researchers who produced the ICRIER-GC paper, such a smoothened curve may mean
nothing more than a statistical necessity for analysis purpose. But to the
farmers, who primarily live off the income of their fields, these year-to-year
fluctuations are matter of life and death for them.
For example, if we
were to assume the temperature increase projections of 2 deg C by 2030 of the
ICRIER-GC study’s is successfully realized, it will be still extremely
erroneous to infer that temperature increases follow a linear pattern
year-to-year. This is so as weather and consequently climate are basically
non-linear, chaotic systems which means climatic changes are basically random
walks and thus consequently renders most cause-effect assumptions redundant.
Explained more
simply, due to the chaotic and non-linear character of the climate system, the
2012-30 temperature curve could take on different shapes because of these
random walks. For example:
- it is
possible that the planet cools to -2 deg C till 2026 and then temperature
spikes suddenly to demonstrate a +2 deg C temperature anomaly by 2030!
- the
planet warm to 1.8 deg C till 2015, and then rapidly cool to -1.5 deg C
till 2020 and then return to normal by
2027 before demonstrating a + 2 deg C
temperature spike by 2030.
In each of these
hypothetical scenarios, the adaptation strategies that would be needed at
different time points will be different as compared to the standardized
solutions the ICRIER-GC paper dishes out.
Further such linear
projections of temperature rises do not factor in teleconnection climatic
events such as ENSO (El Niño Southern Oscillation) which have an even more
pervasive impact on the Indian summer monsoons. e.g. Let’s assume that the
current monsoon season is influenced midway by an El Niño that can cause below
average rainfall while for 2013-14 and 2014-2015 seasons we have a back-to-back
La Niña that causes above average rainfall within the country.
Such ENSO events can
have an insidious influence on agriculture and to the lives and livelihoods of
our farmers and need to be factored into any adaptation strategies for
agriculture. Even here, the ICRIER-GC paper is found totally lacking.
Weather being also a
chaotic system is the reason why predictions are extremely difficult beyond 5
days, where the skill of the model begins to progressively decline as the time
period extends itself. If this is the situation with weather, imagine the
nightmare of predicting climate changes! Monsoons additionally show wide
variability at the inter-annual and decadal scales in terms of its overall
mean, spatial distribution and “breaks”.
Climate Smart
Agriculture (CSA) therefore should encourage adopting flexible year-to-year
adaptation solutions that find a strong alignment with the monsoon’s natural
dynamic behavioral characteristics. Instead what we find are NGOs offering
straight jacket, one-fit-all solutions as observed in the ICRIER-GA paper.
CLIMATE CHANGE & CYCLONES
ICRIER-GC: “Overall in India, it is predicted
that, physical impact of climate change will be seen as an (6) increase in the
frequency and intensity of cyclonic storms.”

The AGW theory states
that tropical cyclonic winds would increase with increasing ocean temperature.
But only the northern parts of the Indian Ocean demonstrated a consistent
warming trend for the period 1976-2007. As seen in the above graphs, the
frequency of cyclones decreased even in the northern parts of the Indian Ocean,
leave alone the Bay of Bengal and the Arabian Sea!!!
These trends are
consistent with global cyclonic/hurricane trends. According to Ryan N. Maue of
the Center for Ocean and Atmosphere Studies, Department of Earth, Ocean and
Atmospheric Science, Florida State University, tropical cyclone accumulated
cyclone energy (ACE) has exhibited strikingly large global inter-annual
variability during the past 40-years. Since 2006, Northern Hemisphere and
global tropical cyclone ACE has decreased dramatically to the lowest levels
since the late 1970s. Additionally, the global frequency of tropical cyclones
has reached a historical low. The latest ACE graph is given below from which it
can be discovered how low it is.

Tropical cyclones have active and passive
cycles, alternating roughly every 20-25 years. Since AGW ignores natural
variability in favour of CO2 as the prime driver of climate, the lack of
frequency and intensity of global tropical cyclones hitting a low, ended up
falsifying the AGW theory.
Eating crow, the latest SREX IPCC AR5 report
finally conceded there is no scientific evidence to attribute extreme events
like cyclone to AGW:
“There is low confidence in any observed long-term (i.e., 40
years or more) increases in tropical cyclone activity (i.e., intensity,
frequency, duration), after accounting for past changes in observing
capabilities.”
Yet, we find the ICRIER-GC paper still warning us of increasing cyclones!
3. How has climate changed in the past and what can we learn from them
in terms of its impact on agriculture?
Synopsis: “Global
cooling is generally associated with a collapse of civilization whereas global
warming is associated with great advances in civilization… If we need to fear something, then the best
candidate is a global mega-drought associated with cooling and driven by solar
activity. ” (Ian Plimer).
The Little Ice Age
and Medieval Warm Period readily testifies to this fact. Besides, if increasing
temperature and CO2 are detrimental to agriculture, it won’t be possible to
explain how global agriculture production demonstrated an almost a 4 fold
increase during the last century.
Carbon is the
building block of life. Notwithstanding the attempts by climate activists to
term it a pollutant, all life in Earth is carbon based life forms, with a
handful of exceptions.
The carbon cycle
moves carbon from the atmosphere, through the food web, and returns to the
atmosphere. This is through a process called photosynthesis, unique to plants.
Carbon dioxide, water, and sunlight combine to produce glucose, water, and
oxygen as given in the following equation:
6CO2 + 12H2O +
sunlight = C6H12O6 + 6O2
According to AGW
theory, an increase in CO2 leads to increases in global temperatures which in
turn should induce an increase in global humidity and precipitation trends
through the augmentation of water evaporation. So all three inputs -
temperature, CO2 and water availability (increase precipitation from ocean
warming) - critical for photosynthesis, should be theoretically increasing
according to AGW theory due to global warming. We know for sure that CO2 has
increased in the atmosphere as we can physically measure it. We are further
told the world is warming with various data but the surprising aspect of this
claim is the absence of statistically significant increased humidity and
precipitation trends which must accompany a global warming trend! In fact,
global humidity and precipitation trends offer themselves as the perfect
proxies for temperature trends!
Theoretically, by
increased availability of critical inputs in a chemical reaction like
photosynthesis, agriculture productivity can be increased. This hypothesis is
proved in practice through the use of greenhouses or glasshouses in agriculture
wherein both temperature and CO2 levels are elevated to result in increased
yields.
We are told by the
AGW theory that CO2 drives temperatures and not the other way around. This
claim is falsified as CO2 levels rises and falls with the seasons or time of
day. CO2 levels rise in the autumn and winter as temperature declines as green
plants go dormant or die. The plants cease to “process” CO2 as part of their
food chain. In spring and summer, CO2 levels fall as temperature rises, these
same plants come back to life and consume CO2 in photosynthesis CO2 levels
accordingly fluctuate due to the differential metabolic rates of plants during
nights and days. The principle of greenhouse/glasshouse centres on increasing
agriculture productivity through not only controlling temperatures and CO2
levels but also by ensuring their elevated levels during the growing season of
plants besides increasing nocturnal productivity of plants for higher yields.

CO2’s beneficial
effect to agriculture by acting as an aerial fertilizer is proved by many
research studies. Physiologically, most plants growing in enhanced CO2
environments exhibit increased rates of net photosynthesis.
The higher
photosynthesis rates are then manifested in higher leaf area, dry matter
production, and yield for many crops (Kimball, 1983; Acock and Allen, 1985;
Cure, 1985). In several cases, high CO2 has contributed to upward shifts in
temperature optima for photosynthesis (Jurik et al., 1984) and to enhanced
growth with higher temperatures (Idso et al., 1987).
CO2 enrichment also
tends to close plant stomates, and by doing so, reduces transpiration per unit
leaf area while still enhancing photosynthesis.
However, crop transpiration per ground area may not be reduced
commensurately, because decreases in individual leaf conductance tend to be
offset by increases in crop leaf area (Allen et al., 1985).
In any case, higher
CO2 often improves water-use efficiency, defined as the ratio between crop
biomass accumulation or yield and the amount of water used in
evapo-transpiration. Increases in photosynthesis and resistance with higher CO2
have been shown to occur at less than optimal levels of other environmental
variables, such as light, water, and some of the mineral nutrients (Acock and
Allen, 1985).
The above graph
illustrates the perfect correlation of food production and increase in CO2
atmospheric concentration. But correlation is not causation and the Green
Revolution and Norman Borlaug had alot to do with the food production increase
seen during this period. But what it does confirm is that increasing
temperatures and CO2 doesn't seem to have any detrimental effect on food
production.
Nonetheless, a 2009 research study conducted by the University of Illinois and the U.S. Dept. of
Agriculture, published in the journal Proceedings of the National Academy of
Sciences concluded elevated levels of CO2 significantly boosts plant
respiration which in turn significantly boosts yields. Since plants draw CO2
from the atmosphere and make sugars through the process of photosynthesis the
study aimed to ascertain how elevated CO2 affects plant respiration and
accordingly influence future food supplies by the extent to which plants can
capture CO2 from the air and store it as carbon in their tissues. Plants were
grown in an environment containing CO2 at 550 ppm compared to those grown in
ambient conditions with CO2 380 ppm. Their conclusion:
"At least 90
different genes coding the majority of enzymes in the cascade of chemical
reactions that govern respiration were switched on (expressed) at higher levels
in the soybeans grown at high CO2 levels. This explained how the plants were
able to use the increased supply of sugars from stimulated photosynthesis under
high CO2 conditions to produce energy.
The rate of
respiration increased 37 percent at the elevated CO2 levels. The enhanced
respiration is likely to support greater transport of sugars from leaves to
other growing parts of the plant, including the seeds.
The expression of
over 600 genes was altered by elevated CO2 in total, which will help to
understand how the response is regulated and also hopefully produce crops that
will perform better in the future."
Despite all the
beneficial effects of increased CO2 to agriculture, climate alarmists tell us
that these basic principles of science do not work in the present climate
‘crisis’ as climate as a system has become more complex and the present warming
trends if allowed to accelerate would adversely affect agriculture. If this is true, it needs to be validated
from past climatic behavioral impact on agriculture. So let’s have a look at it.

As it is not possible
here to discuss the effects of climatic changes on agriculture during Earth’s
entire geological history, this paper will confine its scope to the last 2,000
years. The graph above clearly
establishes that both temperature and CO2 has widely fluctuated within Earth’s
geological history, showing poor correlation with each other.
We are presently
within the Holocene Epoch, an inter-glacial period within the present Ice Age.
The typical inter-glacial period lasts around 12,000 years though there is a
one or two that lasted around 28,000 years. Since the Holocene Epoch’s
estimated age is over 11,500 years, it’s anyone’s guess when it is ending. Man
evolved during the last ice age, the Younger Dras and lived mainly as food
gathers and scavengers.
Modern man apparently
evolved into his current genotype between 40,000 and 200,000 years ago. But it
was only because of the warmth provided during the Holocene; he was able take
to agriculture, by actually growing crops from which he had so far only
collected till then.
The rapid cooling in
the late glacial period took about 100 to 150 years to complete and realized
about 2 deg C variation in temperature within 100 years, more than is being
forecast for the next century. There were at least 3 periods in the current
epoch that were warmer than present - the Holocene Optimum; Roman Optimum and
the Medieval Warm Period (MWP). Even the IPCC admits:
“The early Holocene
was generally warmer than the 20th century”.
Since CO2 levels were
lower in these periods despite temperatures being higher than present, these
eras contradicts the AGW Theory of CO2 driving up temperatures.
MEDIEVAL WARM PERIOD

The Medieval Warm
Period (MWP) being more recent to current times offers a great deal of
literature as documented evidence of the period. MWP refers to a time interval
between AD 900 and 1300 which were warmer than during the period known as the
Little Ice Age that followed it, and also warmer than the period of glacial
advance preceding the MWP. Large extents of Iceland were farmed in the 10th
century AD. At this time, Norse Vikings colonised Greenland, while a reduction
of sea ice allowed regular voyages at these northern latitudes. The Vikings
could do this because there was less sea ice. They travelled by boats to
Greenland among other places through seas that would later become blocked by
sea ice during the Little Ice Age.
During the MWP,
history records tremendous growth in the population, major construction
projects, a significant expansion in arts and culture - all indicating of
a that society that is prosperous. The population growth of
Europe had exploded, reaching levels that were not matched in some places until
the nineteenth century. If the population is expanding, food must be plentiful,
disease cannot be overwhelming, and living standards must be satisfactory. Art
and culture flourished - the Renaissance, Shakespeare, Haydn, Schubert, Mozart,
and Beethoven all belong to this time all indicating prosperity.
LITTLE ICE AGE (LIA)
The transition from
the Medieval Warming to the Little Ice Age (LIA) seems to have been abrupt with
climate change believed to have occurred in less than three decades and was
caused by a decrease in solar activity. LIA announced its arrival in a
spectacular manner - the failure of agriculture to cope with cooling led to mass
famines and this is how Wikipedia described it:
“The Great Famine of
1315–1317 (occasionally dated 1315–1322) was the first of a series of large
scale crises that struck Northern Europe early in the fourteenth century.
From the Pyrenees to
Russia and from Scotland to Italy it caused millions of deaths over an extended
number of years and marks a clear end to an earlier period of growth and
prosperity during the eleventh to thirteenth centuries..”
While not a true ice
age, the term was introduced into the scientific literature by François E.
Matthes in 1939. The Little Ice Age had two distinct phases: in phase one, from
1280 to 1550 AD, the climate was characterized by large and sudden variations
in temperature. In phase two, from 1550 until 1850 AD, it was still colder. The
period known as the Maunder Minimum (1645 – 1715) was the coldest time within
the Little Ice Age and coincidence with a period where sunspots were extremely
rare. Professor Ian Plimer in his book Heaven and Earth describes the impact of LIA on agriculture:
“Land abandonment,
crop failure and soil losses were catastrophic because 90% of the population
were subsistence farm families who needed enough grain to see them through
winter and enough spare grain to sow for the following year’s crop. Both the
quantity and quality of harvests were vital for survival. Grain rotted in the
fields and sometimes couldn’t be planted at all.
Crop failure led to
famine, famine led to disease and death, famine led to a breakdown in society
and even cannibalism. Gangs of desperately hungry peasants roamed the
countryside searching for food. The harvesting and storage of wet grain,
especially rye, stimulated ergot fungus which ruined grain stockpiles. Hungry
people ate mouldy grain which contained fungal toxins.”
The noted
climatologist HH Lamb, who established the Climate Research Unit (CRU), East
Anglia University, UK pointed out that growing season changed by 15 to 20
percent between the warmest and coldest times of the millennium. That is enough
to affect almost any type of food production, especially crops highly adapted
to use the full-season warm climatic periods. Using the price of wheat and rye,
respectively, in various European countries during the LIA, Lamb correlated the
variable with cold intensity.
Each of the peaks in
prices corresponds to a particularly poor harvest, mostly due to unfavourable
climates with the most notable peak in the year 1816 - "the year without a
summer." One of the worst famines in the seventeenth century occurred in
France due to the failed harvest of 1693. Millions of people in France and
surrounding countries were killed at the time of Marie Antoinette, the last
Queen of France in the 1790s who asked peasants to eat cake when peasants had
no bread.
According to Lamb, in
Greenland, the Vikings did not survive the Little Ice Age. Greenland colonized
during the Medieval Warming when the population was able to grow wheat and
grass for their cattle and sheep; the cooling at the onset of the Little Ice
Age brought about freezing temperatures that resulted in crop failures and
famine. Increased sea ice made it difficult for fishing boats to reach the open
sea. The dramatic malnourishment of the Viking population was demonstrated in a
study that compared the height of skeletons before and after the onset of the
Little Ice age. The average height of skeletons buried in the first 200 years
after the beginning of the Little Ice Age is 12 cm (about 4 inches) less than
skeletons buried during the Medieval Warming.

Dr Briesen, a
visiting Professor at JNU, Delhi in a lecture gave an insightful understanding
of the historic significance of the LIA. The cooling led to periodic outbreak
of famines and agriculture stagnation that created a “hunger crisis” with an
estimated 60 per cent of the European population simply struggling for
survival. And as Europe's economy and agriculture went into a tailspin, this
led to huge social unrest and political instability, plunging Europe into many
major wars, the emphasis shifted to strengthening European armies and navies.
This was a period also coinciding with the largest out-migration ever seen
in their history, with Europeans drawn to new lands like North and South
America, Africa, Australia and Asia.
The hunger crisis
also created a powerful motivation for Europeans to get aggressive to conquer
other parts of the world including India.
The late M.H. Panhwar, a historian from undivided India wrote an
excellent book how the LIA affected the Indian sub-continent who were
colonalized by different forces, including various European powers and the
Central Asian Islamists during this time. Read here.
Since the 17th
century, as European powers set up colonies in other parts of the world, new
food products began arriving in Europe, which had been produced abroad to serve the needy European consumers
there. The foundations for a new food cycle were, ironically, laid outside
Europe. Potatoes, for instance, originated from South America, liquor in large
quantities was first distilled in the English colonies in North America,
refined sugar imported from the Dutch, French and later English colonies,
coffee initially from Mauritius and Sri Lanka and others.
“The demand for
colonial commodities and the nutrition crisis modified European, including
German, agriculture and led to the production of sugar beet, potato, and
chicory. This production had a deep impact on agriculture and induced an often
underestimated technological revolution in agriculture,” contended Dr Briesen.
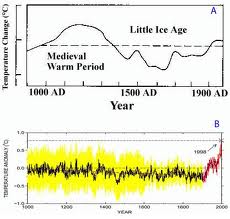
BEING AN INCONVENIENT FACT, THE IPCC ERASES THE MWP & LIA

In their first report
AR1 in 1990, the IPCC acknowledged that the periods such as the Holocene
Optimum, the Roman Optimum and Medieval Optimum were warmer than present times.
This could be observed in the upper graph. By 2001, the graph was changed with
both the MWP and LIA disappeared and modern day warming represented as warming
steeply, giving the shape of a hockey stick as seen in the bottom graph. It was
produced by an IPCC climatologist called Michael Mann, who was then a Phd
student who used tree rings as a temperature proxy.
The use of tree ring
violates IPCC own standards in the use of proxies. In Section 2.3.2.1 of the
IPCC TAR WG1 (Paleoclimate proxy indicators) has a whole sub-section devoted to
a detailed discussion of tree ring data which indicates a very clear and
explicit discussion of the shortcomings of high latitude tree rings and
therefore discouraging its adoption as a proxy.
The hockey stick was
consequently falsified by climate sceptics in peer researched studies and
exposed for gross data manipulation, which Climategate emails exposed, was
designed “to hide the decline” (temperatures). The statistical techniques used
by Mann meant that whatever random numbers punched in, always generated always
a hockey stick curve! The IPCC stopped using the hockey stick in their 2007
report and even removed it from their 2001 report, so much was their
embarrassment.
One of the defenses
of Michael Mann for the statistical treatment of historic temperatures in the
hockey stick was the claim that the MWP and LIA were Europe or Northern
Hemisphere specific climatic events. However, there are now several peer
reviewed studies that prove that MWP and LIA were truly global events with
evidences from all over the world. These are collaborated with evidence from
other disciplines - history; archaeology; geology; literature; paintings
etc. A new peer reviewed study
published in the renowned science journal - Earth and Planetary Science Letters
- hammered the final nail to Mann’s hockey stick - by providing scientific
evidences that the effects of the MWP and LIA were felt as far south in
Antarctica.
The Little Ice Age
and Medeival Warm Period readily testifies to this fact the warming is
beneficial for agriculture while cooling is detrimental. Now a new study
published in the Journal of Geographic Sciences, using Leaf Area Index (LAI),
concluded that LAI is on the increase during the present warming period. Three
Chinese scientists used satellite data to detect changes occurring in
vegetation throughout the world and concluded:
“Results show that,
over the past 26 years, LAI has generally increased at a rate of 0.0013 per
year around the globe. The strongest increasing trend is around 0.0032 per year
in the middle and northern high latitudes (north of 30°N). LAI has prominently
increased in Europe, Siberia, Indian Peninsula, America and south Canada, South
region of Sahara, southwest corner of Australia and Kgalagadi Basin; while
noticeably decreased in Southeast Asia, southeastern China, central Africa,
central and southern South America and arctic areas in North America.”
Source: Liu, S., R.
Liu, and Y. Liu. 2010. Spatial and temporal variation of global LAI during
1981–2006. Journal of Geographical Sciences, 20, 323-332.
A recent article in Forbes hits the hammer on the nail:
“A recent study of a
wide variety of policy options by Yale economist William Nordhaus showed that
nearly the highest benefit-to-cost ratio is achieved for a policy that allows
50 more years of economic growth unimpeded by greenhouse gas controls.
This would be
especially beneficial to the less-developed parts of the world that would like
to share some of the same advantages of material well-being, health and life
expectancy that the fully developed parts of the world enjoy now. Many other
policy responses would have a negative return on investment. And it is likely
that more CO2 and the modest warming that may come with it will be an overall
benefit to the planet.”
Removing subsidy for
chemical fertilizers in the Indian economy perhaps cannot be accomplished
without some adverse impact on agricultural yields. But pump more CO2 into the
atmosphere and this negative impact on removal of fertilizer subsidy will find
a mitigatory effect. The more CO2 pumped into the atmosphere, the greater this
mitigatory effect.
4. What is the basis for predicting future climate?
Synopsis: There are
two approaches to climate prediction. One approach is through use of AGW based
climate models and the other is through models based on observational data and
natural modes of climate variability. The ICRIER-GC paper bases its future
projections on AGW climate.
“The hypothesis and
the computer model simulation used to predict global climate has consistently
failed. It’s not surprising because weather forecast models don’t work either,
and climate is the average of the weather. It is not science and should never
be the basis of policy. “
(Richard Lindzen -
Professor in MIT and a former IPCC Lead Reviewer, who quit the body accusing
the IPCC of being a political rather than a scientific body).
The observation of
rising atmospheric CO2, alone, is not enough to certify anything except a
rising level of atmospheric CO2. Not one of the projections of climate models
had been realized, throwing the AGW theory in disarray.
On the other hand,
models based on natural climate indices have runaway successes of predicting
the past and present climate and therefore more suited for forecasting future
climates.
CLIMATE MODELS
ICRIER-GC: “It is
predicted that for every 2 deg C (which has been predicted by 2030) rise in
temperature, the GDP will reduce by 5 per cent.”
The media and NGOs
act as if there is a ring of absolute certainty about these “predictions”. But
they are not even “predictions” as admitted by the IPCC but merely “projections
under various assumption scenarios”. The basis of ICRIER-GC study is entirely
on the projections of these climate models though they treat them as
“predictions”.
According to the 2007
AR4 report of the IPCC; model based projections of future global warming range
from a 1.1 C to a 6.4.C temperature. Recent studies go even further to project
an increase of more than 8 degrees. Such a massive range implies enormous
uncertainty in climate modelling results.
In one of the IPCC reports viz AR3 2001, the IPCC admitted:
“In sum, a strategy
must recognise what is possible. In climate research and modelling, we should
recognise that we are dealing with a coupled non-linear chaotic system, and
therefore that the long-term prediction of future climate states is not
possible.
The most we can
expect to achieve is the prediction of the probability distribution of the
system’s future possible states by the generation of ensembles of model
solutions. This reduces climate change to the discernment of significant
differences in the statistics of such ensembles.”

A German Phd thesis commented in the
same vein:
“The chaotic, nonlinearity of the climate not
only prevents a thorough understanding of the system but also the impossibility
of observing all relevant climate variables in the oceans, the atmosphere, and
other spheres...
The main practical problem of climate
modelling is the problem of parameterisation, which is the need to represent
processes of the climate system in the modelling approach that are
insufficiently understood or on a smaller scale than the resolution of the
model.
Parameterisations in nonlinear models make it
nearly impossible to detect chains of causes and effects in a climate model.
There are many processes in the climate system which has already been
discovered but which are not understood or are too small to consider in climate
models.
In order to nevertheless represent them in
models simulating the climate they are displayed as parameters. Some
parameters’ values can be assigned that have counterparts in the real world but
others result only from model fitting...
This lack of data is a fundamental problem
and the most important one for climate modelling. The nonlinearity of the
climate system is accompanied by its enormous complexity, which makes it even
more disturbing. Many climatic processes originate in internal feedback
mechanisms of the system’s dynamics that interact in a nonlinear and thus
unforeseeable way.”
If the model is flawed, if important parts
have been left out, or the initial conditions are incorrect, no model can
provide trustworthy answers. It is an axiom of mathematical modelling of
natural processes that only a fraction of the various events, large and small,
that constitute the process are actually expressed in the equations. The other
points may not be so self-evident or absent. And this is only one of its
fundamental problems of computer models.
The major limitations of computer models are:
1. Model imperfection 2. Omission of important processes 3. Lack of knowledge
of initial conditions 4. Sensitivity to initial conditions 5. Unresolved
heterogeneity 6. Occurrence of external forcing 7. Inapplicability of the
factor of safety concept.
Nevertheless, the use of computer models has
been passed off as science fact when it is actually a technique used when real
observations and genuine understanding are not available. As fundamentally weak
as the IPCC's methodology is, the media and the public are brainwashed that
facts have been established and consensus has been reached in the scientific
community.
In a chaotic system, very tiny changes can
create large impacts. This logic had been used to support the claim that
CO2 which constitute a miniscule 0.03% of the atmosphere is the main driver of
climate change. Applying the same logic, climate computer models embedded with
colossally large error rates should generate even greater degree of errors in
their forecast of future global temperatures.

But a group of scientists led by Dr.
Koutsoyiannis used the IPCC’s gridded 20th century global climate to
reconstruct what these climate models said about the 20th century temperature
record of the continental US. The IPCC's GCM climate models got it very wrong.
They also used the GCM retrodiction to reconstruct the 20th century temperature
and precipitation records at 58 locations around the world. The reconstructions
failed badly on comparison with the real data. This raises a fundamental
question. Since the experiment proved that the IPCC climate models cannot
reproduce the known climate, why should anyone believe they can reliably
predict an unknown climate.
A random walk is a mathematical formalisation
of a trajectory that consists of taking successive random steps.
A 2011 study
using the random walk concept gave a confirmation why AGW based climate models
are unsuitable for providing inputs for policy making. Published in the Journal of
Forecasting the study took the same data set and compared model
predictions against a “random walk” alternative, consisting simply of
using the last period’s value in each location as the forecast for the next
period’s value in that location. The test measures the sum of errors relative
to the random walk. The climate models got scores ranging from 2.4 to 3.7,
indicating a total failure to provide valid forecast information at the
regional level, even on long time scales. The authors commented:
“This implies that the current [climate]
models are ill-suited to localized decadal predictions, even though they are
used as inputs for policy making.”……”
Dr Andy Edmonds in an incisive article
entitled “The Chaos theoretic argument that undermines Climate Change
modelling” in the blog WUWT observed:
“So, what does it mean to say that a system
can behave seemingly randomly? Surely if a system starts to behave randomly the
laws of cause and effect are broken?
Chaotic systems are not entirely unpredictable, as
something truly random would be. They exhibit diminishing predictability as
they move forward in time, and this diminishment is caused by greater and
greater computational requirements to calculate the next set of
predictions....prediction accuracy will drop off rapidly the further you try to
predict into the future. Chaos doesn’t murder cause and effect; it just wounds
it!
Edward Lorenz estimated that the global weather exhibited
a Lyapunov exponent equivalent to one bit of information every 4 days. This is
an average over time and the world’s surface. There are times and places where
weather is much more chaotic, as anyone who lives in England can testify. What
this means though, is that if you can predict tomorrows weather with an
accuracy of 1 degree C, then your best prediction of the weather on average 5
days hence will be +/- 2 degrees, 9 days hence +/-4 degrees and 13 days hence
+/- 8 degrees, so to all intents and purposes after 9-10 days your predictions
will be useless. Of course, if you can predict tomorrow’s weather to +/- 0.1
degree, then the growth in errors is slowed, but since they grow exponentially,
it won’t be many days till they become useless again.
Interestingly the performance of weather predictions made
by organisations like the UK Met office drop off in exactly this fashion. This
is proof of a positive Lyapunov exponent, and thus of the existence of chaos in
weather, if any were still needed.
So that’s weather prediction, how about long term
modelling?”
In 2005, NASA boss James Hansen stated in an article in
the journal ‘Science’ that confirmation of the planetary energy imbalance can
be obtained by measuring the heat content of the oceans which are the principal
reservoir for excess energy.
A problem for the AGW hypothesis now is that the oceans have been cooling as
measurements from thousands of Argo sensors floating on the sea indicate.
So the lame explanation that:
“Overall, the missing heat doesn't change expectations
for future climate change, because the heat won't stay missing forever.
Eventually it will resurface and impact the climate system, and the recent and
deceptive reprieve from rapid warming we've enjoyed will come to an expected
end.”
Indeed there is no known mechanism to account
for what some describe as vast amounts of missing heat, suggesting that
contrary to the AGW hypothesis, heat is not accumulating in the climate system
and there is no longer any radiative imbalance from all the carbon dioxide and
other greenhouse gases.
NATURAL VARIABILITY MODELS
Phil Jones, Director of the CRU, UK when
asked the justification behind attributing global temperatures to human
influence during a BBC interview replied:
“The fact that we can't explain the warming
from the 1950s by solar and volcanic forcing”
So the theory of AGW linked human influence on climate
though they didn’t have any actual physical evidence to support this
hypothesis. They arrived at this conclusion deductively, through the principle
of exclusion. Darwin, on the basis of his own personal experience rejected the
principle of exclusion; at least as a primary scientific tool. However,
alarmist climate science has not. Instead, the principle of exclusion is one of
the most-cited arguments to support the AGW hypothesis. Like Jones, the IPCC’s
2007 report notes:
“Most of the observed increase in globally averaged
temperatures since the mid-20th century is very likely due to the observed
increase in anthropogenic greenhouse gas concentrations.”
The IPCC accordingly offers no empirical proof that human
carbon emissions are the main cause of planetary warming; the “proof” is
that the scientists can’t find another explanation, i.e., the principle of
exclusion.
So climate models were accordingly designed
to over-estimate the contribution of CO2 as the driver of climate and either
excluded or under-estimated the contribution of natural variability. Till 1998,
when the planet was warming, these models appeared infallible as temperature
rises found good correlation fit with their model projections. This followed
the principle that whenever an explanatory variable is omitted from a
statistical analysis, its explanatory power gets wrongly attributed to any
correlated variables that are included.
But after 1998, when temperatures began to trend flat and
later started to marginally decline, AGW based climate models began to look
increasingly fallible. It became obvious that the simplest and most logical
explanation for climate change, in the past, now, and in the future, is natural
variation so much so the latest the latest SREX IPCC AR5 itself
were forced acknowledged its significance:
“...climate change signals are expected to be relatively
small compared to natural climate variability".
So what are those phenomena which constitute
natural variability? There is a whole array of factors of natural variability.
Dr Roy Spencer of NASA-University of Alabama in Huntsville who produces the UAH
Global Temperature dataset took into consideration three of them - Pacific
Decadal Oscillation (PDO) and Atlantic Multi-decadal Oscillation (AMO) which
have similar time scales to warming and cooling periods during the 20th Century
together with the Southern Oscillation Index (SOI), a measure of ENSO activity.
What Spencer did was to come up with a model of
temperature variability, and then see if that statistical model can “predict”
the strong warming over the most recent 50 year period. The falsifiability
criterion for the hypothesis was if the relationship between temperature and
these 3 climate indices for the first half of the 20th Century was just
coincidental, it will fail to predict the temperatures for the latter 50 years
of the last century. He used the concept of temperature change rate, instead of
temperature. This is because if natural climate cycles are correlated to the
time rate of change of temperature, that meant they represented heating or cooling
influences, such as changes in global cloud cover (albedo).
He then chose to use the (Had)CRUTem3 yearly record of
Northern Hemispheric temperature variations for the period 1900 through 2009 to
compute the yearly change rates in temperature. He then linearly regressed
these 1-year temperature change rates against the yearly average values of the
PDO, AMO, and SOI. The period from 1900 through 1960 was used for “training”to derive this statistical relationship, and then applied it to the period 1961
through 2009 to see how well it predicted the yearly temperature change rates
for that 50 year period. Then, to get the model-predicted temperatures, he
simply added up the temperature change rates over time.

The result of this exercise in shown in the
plot above that amazingly found a tight correlation fit between the rate
of observed warming of the Northern Hemisphere since the 1970’s and the PDO,
AMO, and SOI together predict, based upon those natural cycles’ previous
relationships to the temperature change rate (prior to 1960).
It is to be noted that this model cannot
predict future global temperature but can only confirm the correlation between
natural variable indices and global temperatures observed. This is because it
doesn’t have the ability to be extended into the future, as the future PDO,
SOI, and AMO haven’t yet been observed.
PACIFIC DECADAL
OSCILLATION (PDO)
The Pacific Decadal
Oscillation (PDO) is the predominant source of inter-decadal climate
variability in the Pacific Northwest (PNW). The PDO (like ENSO) is
characterized by changes in sea surface temperature, sea level pressure, and
wind patterns. The PDO is described as being in one of two phases: a warm phase
and a cool phase. The PDO shifts its modes alternately once every 25-30 years
bringing about climatic flips within the same time intervals and as seen below:
1.
1890 to 1925 Cold
2.
1925 to 1946 Warm
3.
1945 to 1977 Cold
4.
1977 to 2007 Warm
5.
2007 to 2030 Cool??
Global average
temperatures since 1890 accordingly appear to follow a predictable path cold-warm alternate cycles that finds a
correlation fit with the PDO cycle.
CLICK IMAGE TO ENLARGE
These cold-warm alternating cycles are well
documented by the media coverage of climate during these epochs. The
media have warned about impending climate “doom” four different times in
the last 100 years.
Many publications now claiming the world is
on the brink of a global warming disaster said the same about an impending ice
age – just 30 years ago. Several major ones, including The New York Times, Time
magazine and Newsweek, have reported on three or even four different climate
shifts since 1895.
From 1945 t0 1977, the PDO switched to its
cold mode that brought a mild cooling globally. And just as climate hysteria
was warning of an impending ice age, the PDO switched to its warm mode in 1977
that brought about the most recent warming episode. Since 1998, the PDO however
had been switching erratically between warm and cold to warm modes until 2007,
when it slipped into its cold mode decisively. A month before the
Copenhagen Climate Summit in 2010, Mojib Latif a well known warmist scientist
from the Max Plank Institute in Germany, publicly admitted that global warming
would be taking a vacation for the next 20-30 years. Though Latif attracted
alot of flak from climate alarmists for this admission, he was apparently
basing his assessment from the PDO switching to is negative mode.
Though AGW is not able to explain the lack of warming
during the last decade and still searching for the “missing heat”, the
PDO switching to its cold mode is able to perfectly explain it. Now that
the PDO has shifted to its negative mode, any adaptation strategy for
agriculture should be for global cooling that can be expected to last for the
next 20-30 years.
As seen from the above graphs, El Niños tend to be
more frequent and demonstrate higher intensity during the warm phase of a PDO
while La Niñas tend to be more frequent and demonstrate higher intensity during
the cool phase of a PDO.
With reference to India, El Niños usually bring
deficient rainfall as seen during the 2009-10 monsoon season while La Niñas
bring above average rainfalls as seen during the 2010-11 and 2011-12 monsoon
seasons. Consequently, being a monsoon dependent economy, agriculture growth
rate spikes during La Niña years while plunges during an El Niño year, though
irrigation expansion over the years have cushioned its adverse effects
significantly in recent times.
SUNSPOTS

As the graph illustrates,
solar irradiance (brightness) has been increasing since the Little Ice Age
(LIA) that seem to suggest a high correlation fit with global temperature rise.
After 1700 A.D., the number of observed sunspots increased sharply from nearly
zero to more than 50 and the global climate warmed. Between 1930 and 2000, the
Sun was more active than at almost any time in the last 10,000 years.
It wasn't until 1980, with the aid of NASA
satellites, that scientists definitively proved that the sun's brightness - or
radiance - varies in intensity, and that these variations occur in predictable
cyclical patterns.
This was a crucial
discovery because the climate models used by AGW proponents always assumed that
the sun's radiance was constant. With that assumption in hand, they could
ignore solar influences and focus on other influences, including human.
That turned out to be a
reckless assumption. Further investigation revealed that there is a strong
correlation between the variations in solar irradiance and fluctuations in the
Earth's temperature. When the sun gets dimmer, the Earth gets cooler; when the
sun gets brighter, the Earth gets hotter. So important is the sun in climate
change that half of the 0.6° C temperature increase since 1850 is directly
attributable to changes in the sun. According to NASA scientists David Lind and
Judith Lean, only one-quarter of a degree can be ascribed to other causes, such
as greenhouse gases, through which human activities can theoretically exert
some influence.
“Early records of sunspots indicate that the
Sun went through a period of inactivity in the late 17th century. Very few
sunspots were seen on the Sun from about 1645 to 1715. Although the
observations were not as extensive as in later years, the Sun was in fact well
observed during this time and this lack of sunspots is well documented.
This
period of solar inactivity also corresponds to a climatic period called the
"Little Ice Age" when rivers that are normally ice-free froze and
snow fields remained year-round at lower altitudes. There is evidence that the
Sun has had similar periods of inactivity in the more distant past.”
As Professor Easterbrook
further observed:
“The global cooling that occurred during the Maunder Minimum was
neither the first nor the only such event. The Maunder was preceded by the
Sporer Minimum (~1410–1540 A.D.) and the Wolf Minimum (~1290–1320 A.D.) and
succeeded by the Dalton Minimum (1790–1830), the unnamed 1880–1915 minima, and
the unnamed 1945–1977 Minima (Fig.). Each of these periods is characterized by
low numbers of sunspots, cooler global climates, and changes in the rate of
production of C14 and Be10 in the upper atmosphere. As shown in Fig. each
minimum was a time of global cooling, recorded in the advance of alpine
glaciers...
What can we learn from this historic data?
Clearly, a strong correlation exists between solar variation and temperature.
Although this correlation is too robust to be merely coincidental, exactly how
solar variations are translated into climatic changes on Earth is not clear.
For many years, solar scientists considered variation in solar irradiance to be
too small to cause significant climate changes.
However, Svensmark (Svensmark and Calder,
2007; Svensmark and Friis-Christensen, 1997; Svensmark et al., 2007) has
proposed a new concept of how the sun may impact Earth’s climate. Svensmark
recognized the importance of cloud generation as a result of ionization in the
atmosphere caused by cosmic rays. Clouds reflect incoming sunlight and tend to
cool the Earth. The amount of cosmic radiation is greatly affected by the sun’s
magnetic field, so during times of weak solar magnetic field, more cosmic
radiation reaches the Earth. Thus, perhaps variation in the intensity of the
solar magnetic field may play an important role in climate
change.”
But confirmation of Svensmark’s theory last
year came from CERN, the European Organization for Nuclear Research, and the
world's leading laboratory for particle physics. Last year CERN published a
paper in Nature, the most cited science journal entitled Role of sulphuric
acid, ammonia and galactic cosmic rays in atmospheric aerosol nucleation.
The findings of this paper have significant
implications for climate science because water vapour and clouds play a large
role in determining global temperatures. Tiny changes in overall cloud cover
can result in relatively large temperature changes - supporting a "heliocentric"
rather than "anthropogenic" approach to climate change since
the sun plays a large role in modulating the quantity of cosmic rays reaching
the upper atmosphere of the Earth.
Jasper Kirkby of CERN observed in a press
release:
"We’ve found that cosmic rays
significantly enhance the formation of aerosol particles in the mid troposphere
and above. These aerosols can eventually grow into the seeds for clouds...”
Former ISRO physicist chairman who is also
one of India’s well respected scientists, Dr. U.R. Rao similarly proved
cosmic rays having a much larger impact on global warming than IPCC claims. Dr
Rao in fact argues that the contribution of decreasing cosmic ray activity to
global warming is almost 40% in a paper published in Current Science, the
preeminent Indian science journal. The IPCC model, on the other hand, says that
the contribution of carbon emissions is over 90 per cent. The continuing
increase in solar activity has caused a 9 per cent decrease in cosmic ray
intensity over the last 150 years, which results in less cloud cover, which in
turn results in less albedo i.e. radiation being reflected back to the space,
causing an increase in the Earth's surface temperature.
In a paper published in the journal - Applied Physics
Research, astrophysicist Dr Habibullo Abdussamatov of Russia’s Pulkovo
Observatory predicted a Little Ice Age (LIA) by 2042 ±11 by looking at Total
Solar Irradiance (TSI).
The current prediction for Sunspot Cycle 24
gives a smoothed sunspot number maximum of about 60 in the Spring of 2013. We
are currently over three years into Cycle 24. The current predicted size makes
this the smallest sunspot cycle in about 100 years. We are now at what should
be the peak (maxima) of ‘Cycle 24’ but sunspot numbers are running at less than
half those seen during cycle peaks in the 20th Century. Analysis by experts at
NASA and the University of Arizona suggest that Cycle 25, whose peak is due in
2022, will be a great deal weaker still.
The polar fields should have flipped at the end
of cycle C23, around 2008-09, but they continued with the same polarity,
showing a stretched pattern similar to what happened at the end of the 1960′s
but more pronounced, which could lead to “break” of the field into a “quadripolar”
mode very soon. This is another indication of the very low intensity of the
present cycle. This low intensity could lead to a period of no sunspots as
observed during the Maunder minimum between the period 1640 to 1710
There is growing evidence that a Grand
Minimum similar to the either the Dalton or Maunder is in our future, see
references here, here,
here,
here and
here.
5. What is
in store for us the next 25-30 years in terms of climate change? Which
strategic direction should Agriculture Adapt?
Synopsis: There could be four plausible climate
scenarios for the next two decades viz.
the status quo continues ; climate reverts back to accelerated warming
trend; climate of mild cooling and climate flipping back to Little Ice Age (LIA)
conditions.
However,
the ICRIER-GC paper’s “adaptation strategies” are ostensibly geared to only one
of these scenarios - climate flipping back to accelerated warming trends. But
this scenario is highly unlikely. Even the IPCC in their latest report rules
out such a scenario for the next two decades!
Considering the climate is a
chaotic and non-linear system, it is not possible to anticipate future climate
behaviour with absolute certainty. Nevertheless, there could be four plausible
scenarios of the climate for the next two decades as discussed below:
SCENARIO 1: STABLE CLIMATE OF LAST DECADE TO
CONTINUE
The first scenario assumes the
last decade’s stable climate with global warming hiatus, if not with
temperatures trending slightly decline will continue till 2030.
Accordingly, the “adaptation
strategies” for agriculture, recommended by the ICRIER-GC paper are irrelevant
as it bases itself on the AGW paradigm.
SCENARIO 2: ACCELERATED GLOBAL WARMING
This scenario assumes this stable state of
climate of the last decade will flip once again to resume the accelerated
global warming trend observed during the 1976-1998 period.
The probability of this scenario is considered very
unlikely as even the latest SREX IPCC Report AR5 ruled
it out:
“...climate change signals are
expected to be relatively small compared to natural climate variability".
Global temperatures are
currently demonstrating a marginal decline. But even so, if the climate were to
reverse back to its accelerated warming path, there would still no hurry to put
to work the adaptation strategies for agriculture as recommended by the
ICRIER-GC paper. To borrow an analogy from the equity market, the strategy
would be await a confirmation of bottoming up and evidence of a decisive buy
signal. Accordingly, as and when temperature trends reverses decisively, the
recommendations of the ICRIER-GC paper for agriculture climate adaptation can
then be re-visited to take a call on their relevance.
It is to be appreciated that
agriculture had been performing well during the last global warming cycle
1976-98. Such an outcome cannot be assumed possible without any adaptation by
agriculture to a warming climate. So even if the climate’s random walk results
to the return of an accelerated warming scenario, the adaptation by agriculture
to the last global warming cycle should provide a cushion in terms of its
climate vulnerability if any.
SCENARIO 3:
GLOBAL COOLING

The
third scenario is one where the climate enters into a mild global cooling cycle
brought about by the shift of the Pacific Decadal Oscillation (PDO) to its cold
mode. This scenario is consistent
with SREX IPCC Report AR5 who conceded:
“...climate change signals are expected to be
relatively small compared to natural climate variability".
The
implication of this scenario is a return to the mildly cold temperatures seen
during the period 1945-77 or to a relatively stronger cold period as
experienced during 1890 to 1925. As the PDO shifted to its cold mode as far
back as 2007, we could see the prospect of accelerated cooling kicking in as
early as 2014 after the completion of the solar maxima expected by next
May. But it would be during the next
solar cycle 25, expected to start around 2018-19 where the cooling is expected
to really come into full play.
If
the past is any indication of the future, India has every reason to rejoice.
With above average monsoons to accompany this global cooling cycle expected to
last till 2030, here too the adaptation strategies for agriculture as
recommended by the ICRIER-GC paper become irrelevant as it bases itself on the
AGW paradigm.
Not
only agriculture could be expected to boom during the next two decades, but
India could eye to be one of the biggest exporters of agriculture commodities,
capitalizing on the likely decline of agriculture production in temperate
latitudes encompassing the bread basket of the world - countries such as US,
Canada, Europe and Russia. The latter
will be brought about by not only falling temperatures but shortening of the
growing season.
Continuation
of various agriculture subsidies or even enhancing them within this scenario,
though creating fiscal problems during the near term, could nevertheless yield
India very large paybacks through agricultural exports over the medium to long
timelines.
SCENARIO 4:
RETURN TO THE LITTLE ICE AGE

If
forecasts of LIA were to be realized, then we should be looking at a global
cooling climate for all through the next 100 years, the very least. If the past is an indicator of the future,
then it would be only agriculture within the equatorial latitudes that would be
somewhat be insulated, from LIA’s detrimental impact on agriculture.
Though
initially a LIA may be beneficial for India, as evaporation rates decreases
significantly, it can be expected to in turn lead to decrease rainfall and mega
droughts. In the past, LIA has been
found to often establish itself in a matter of a couple of decades. Radical
adaptation by agriculture would then be required to mitigate LIA impact. But
even here, since the ICRIER-GC paper bases itself on the AGW paradigm, it rules
itself out as an appropriate strategy.
Unlike
other natural variability factors such as PDO, AMO etc, solar effects on
climate however remain a contentious theory. Even among climate sceptics, a
section is not totally convinced about the solar effects on climate.
Additionally, nearly all forecasts of an impending LIA are around the year
2050. This is almost 4 decades away, which provides a time buffer to evolve
suitable adaptation measures, if needed. And hence there is no hurry to
implement currently any radical policy initiatives. A wait and watch policy is
more prudent. Depending upon how Solar Cycle 25 (expected to start around
2018-19) pans out, a more realistic understanding of probabilities of an impending
LIA could be gained and based on this, suitable adaptation strategies for
agriculture could be drawn up.
CONCLUSIONS

People
were racing to Y2K their computers and systems. TV news crews had reporters
stationed at bank machines, at train traffic centers in NYC, at airports, all
waiting to see if the machines and the computers that run them, stopped working
when the clock went from 1999 23:59:59 to 2000 00:00:00 because in the early
days of programming, to save memory, they used two digit years instead of four,
and the fear was that computers would reset themselves to the year 1900 rather
than 2000, and stop functioning.”
These
are extracts from the UK Independent’s article entitled “Is catastrophic global
warming, like the Millennium Bug, a mistake?”
And you can’t blame them. Climate hysteria is littered with a long list
of failed “predictions”, the lack of warming seen during the last decade being
only one of them.
For
example, in 2005, the United Nations Environment Programme predicted that climate
change would create 50 million climate refugees by 2010. These people, it was
said, would flee a range of disasters including sea level rise, increases in
the numbers and severity of hurricanes, and disruption to food production.The
UNEP even provided a handy map. The map showed the places most at risk
including the very climate sensitive low lying islands of the Pacific and
Caribbean. Two years after this deadline had passed, in each and every
location, there was no such evidence come across of such a horrendous calamity
having struck with their population even registering a healthy increase!
Believing
the climate is predictable as the ICRIER-GC paper does, when it is not, does
not make it so. With climate being a chaotic and non-linear system, there is no
model or expert that is currently able to forecast future changes with absolute
certainty. The IPCC tried and failed miserably.
Leave alone the climate, the uncertainties of weather makes accuracy of
advance prediction more than 5 days a challenge which progressively increase as
additional days are added. With more than 100 years of experience, the IMD’s
success rate of predicting the monsoons remain just one of five.
The
reality remains that it is still a matter of conjecture which direction the climate
will flip or how long the global climate’s current stable state will continue.
Policies cannot be formulated based on mere conjectures and blanket exclusions
(in this case, global cooling’s exclusion), particularly in context to a
phenomenon like climate which demonstrates a high level of unpredictability in
its behavioral traits.
Climate
Smart Agriculture therefore should be equated to being prepared for whatever
direction the random walks the climate might take. This is what the ICRIER-GC
paper basically fails to appreciate. If one works out “solutions” assuming an
accelerated global warming future scenario and what we actually get instead is
accelerated cooling or vice versa, rather than enhancing agriculture’s
adaptability to climate changes it ends up increasing its vulnerability to
climate changes!
NGOs
are certainly legitimate part of democratic governance, possessing the right to
influence policy. But this brings us to the question that if we do not
commission an auto mechanic to undertake an open heart surgery, why is it when
it comes to climate change, any Tom Dick or Harry in the NGO sector is allowed
to lay claim to an expertise good enough to write “policy papers” on the
subject when they have not much to talk of?
This
doesn’t mean that they need any formal academic credentials in climatology. All
it means is that they need to have sufficient theoretical grasp of a complex
subject like climate change to be confident enough to publicly debate science
with those who do have the academic training in climatology. This is where the
legitimacy of NGO advocacy campaigns faces immense criticism. They write many
fancy papers but always shy away to openly debate the science of climate change
with qualified climatologists.
Within
this context, attempts by NGOs like Gene Campaign and their researchers
demonstrating an audacity to write a policy paper on how agriculture should
adapt to future climate changes appear an exercise in tragic comedy. A comedy
because of pretensions to an expertise where they had none and a tragedy
because it undermines the credibility of their advocacy campaigns in areas
where they do have the expertise.
Our
recommendation to ICRIER is to withdraw the paper as an official ICRIER policy
paper as it fails to meet the basic standards of research!


